Modeling the best time to fish the Yakima River Canyon
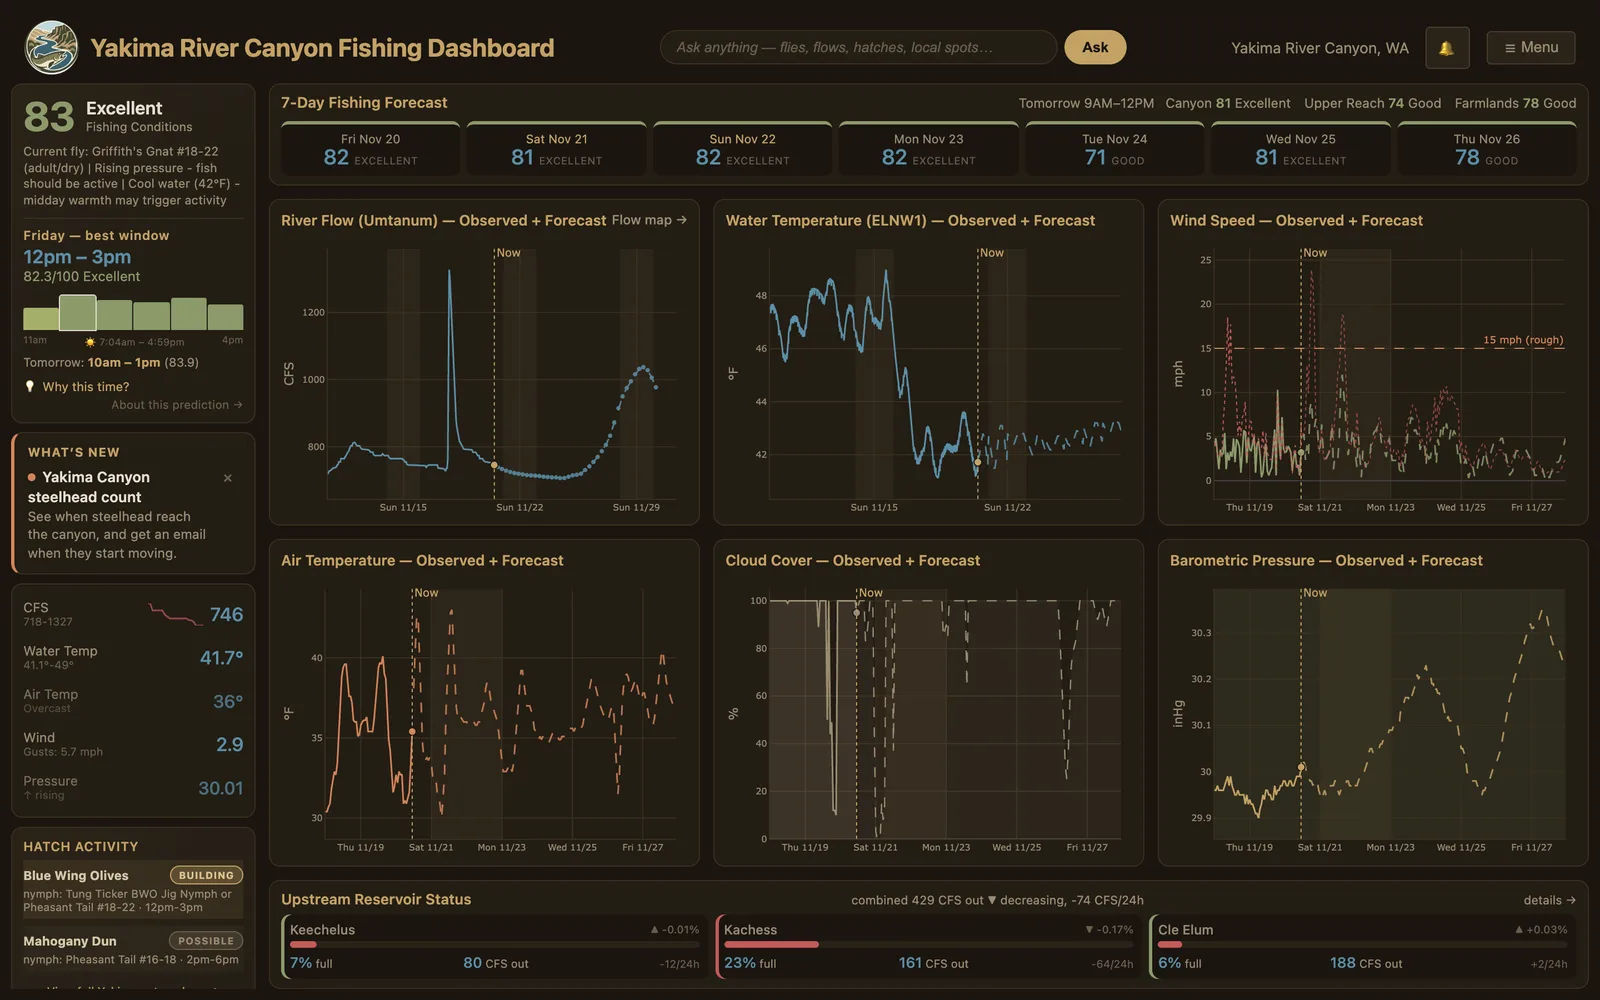
I've fished the Yakima River quite a bit. The Yakima River Canyon dashboard is a model of when to fish it. It takes in years of river and weather data, scores every hour, and forecasts the best hours for the next seven days.
The data underneath
The model starts from an hourly history of the canyon that goes back to January 2014. Flow comes from the USGS gauge at Umtanum, in the middle of the canyon: more than 416,000 readings. Weather comes from Open-Meteo's archive, more than 106,000 hours of air temperature, wind, cloud cover, pressure, precipitation, humidity and solar radiation.
Water temperature comes from NWRFC stations at Kiona since 2019 and Ellensburg since 2024. Dissolved oxygen, turbidity and conductance come from USGS, also since 2019.
A pipeline merges all of it into one row per hour, then adds features. It works out how fast the flow is changing over 1, 6 and 24 hours, and how fast the water temperature is changing over 6 hours. It adds the pressure trend, the hour, day and month, the moon phase and the day length. That gives 27 features for each of about 106,000 hours. A job at 2 a.m. adds the newest data every day.
Scoring an hour
Each hour gets a score from 0 to 100. It's a weighted mix of seven factors: flow, the change in flow, water temperature, wind, cloud cover, time of day and pressure. The weights shift with the season. Water temperature carries the most weight, except in spring, when flow does. Pressure shows almost no relationship in the history, so it gets 5%.
The flow ranges are specific to this river. Each season's best range is the middle half of the flows in hours that scored 70 or better. In spring that's 1,300 to 1,900 cfs. In fall, after the flip-flop, it's 800 to 1,150.
How the flow is moving matters as much as how high it is. Stable flow scores best. A gentle rise comes close, because it knocks insects into the drift. Fast rises and falls score lowest.
The score describes conditions. It isn't a probability of catching a fish, and the methodology page says so.
Forecasting the best hours
The forecast comes from an LSTM, a neural network built for sequences. It reads the previous 48 hours of all 27 features and predicts the score for each hour. It has three layers of 128 units, and it retrains every Sunday on the growing history.
For the week ahead, its inputs are forecasts: NWRFC's flow forecast for Umtanum, Open-Meteo's weather forecast and the dashboard's own water temperature forecast. Each day's best window is the three-hour block of daylight with the highest average score.
Safety rules sit on top of the model. A forecast hour at 7,000 cfs or more is a flood, and it rules out the whole day. Hours above 72 °F are capped one by one, like a hoot-owl closure, and the cooler part of the day can still be recommended.
Forecasting water temperature
Water temperature is one of the two heaviest factors, so the dashboard forecasts it hour by hour. The forecast blends two models. 40% comes from a physical curve that maps air temperature to water temperature. 60% comes from the river's recent hourly pattern, nudged up or down by how the coming air compares with the last day.
The water's daily cycle lags the air's by a number of hours, and that lag changes with conditions. So each run estimates the lag again from recent readings instead of fixing it. The blend weights were chosen on three stations' histories, with the latest 30% of each held back by date for testing.
Hatch timing has its own temperature model. It covers 10 insects and is calibrated on a 15-year record of Yakima hatches.
Checking the model against the river
Every day, the dashboard archives its own flow and water temperature forecasts. Later it scores each one against what the gauges actually read.
The next step is catches. The trip log records effort, the number of anglers and the fish caught, including trips with none. Once there are at least 50 qualifying trips, the model can add real catches, as fish per angler-hour, to what it trains on. Those trips must include 15 with fish and 15 without, from at least five people over at least 60 days. The earliest 80% would train the model and the latest 20% would test it. Until then, the score models conditions, not catches.
Each factor's scoring table is on the dashboard's methodology page.