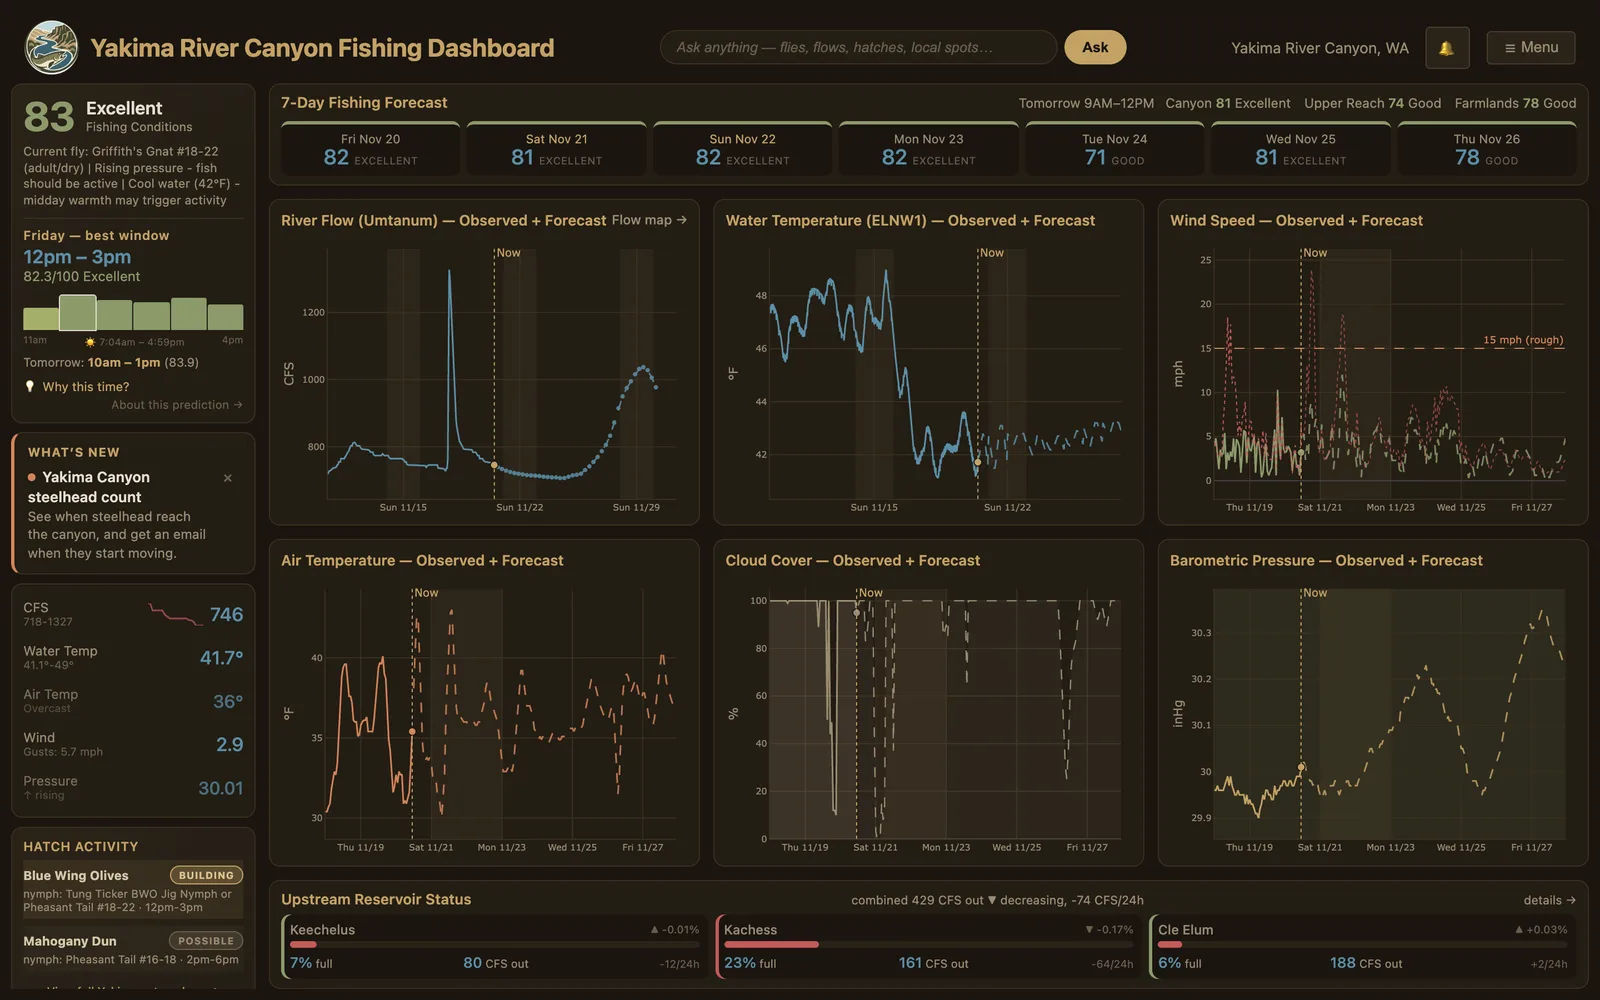
Yakima River Canyon dashboard
A model of the best times to fish the Yakima River Canyon, built on hourly river and weather data back to 2014.
I've fished the Yakima for twelve years, so it gets the most detailed model. The dashboard takes in hourly flow, water temperature, weather and water quality, with flow and weather records back to 2014, and models when the fishing should be best.
- A fishing score from 0 to 100 for every hour, weighted by season. Each season's best flow range comes from the history.
- A best-time forecast from an LSTM: three layers, 128 hidden units and a 48-hour lookback over 27 features, retrained every week.
- A 7-day forecast that names the main driver behind each day, with flood and warm-water limits applied hour by hour.
- A water temperature forecast that blends a physical air-to-water model with the river's recent daily pattern.
- Hatch probabilities for 10 insects, calibrated on a 15-year record of Yakima hatches.
Every day it archives its own forecasts and scores them against what the gauges later read. Trip logs, including trips with no fish, are set up to calibrate the model against real catches once there are enough of them. The details are in Modeling the best time to fish the Yakima River Canyon.
The site also has a river flow map that marks likely eddies, pools and riffles, a float-time estimator, score alerts by email and a steelhead count page for Roza Dam.
Writing about Yakima River Canyon dashboard
Modeling the best time to fish the Yakima River Canyon
How the Yakima Canyon dashboard turns twelve years of hourly river and weather data into a score for every hour and a forecast of the best hours to fish.