How Outfish scores 233 rivers
I built Outfish, which shows live fishing conditions for 233 rivers in the US, Canada and Europe. Each river gets one fishing score from 0 to 100. I love data and I'm a little overly organized, so here is exactly what goes into it.
The score is a heuristic conditions index, not a catch probability or a trained catch-prediction model. It scores seven readings from 0 to 100 each and blends them with weights.
Where the readings come from
Flow comes from gauging stations: USGS for most US rivers, Environment Canada for Canadian ones, and state or national services elsewhere. Wind, cloud cover, pressure, precipitation and air temperature come from Open-Meteo. Flow is cached for 15 minutes. If a source fails, the last good reading can stay up, marked stale.
Water temperature is the awkward one. Rivers with a live sensor use it when available. The rest get a model: the month's configured base, plus a damped share of any air temperature above it, clamped to 0–22 °C. Environment Canada supplies level and discharge but not water temperature, so those rivers always use the model.
In October 2026 the model was checked against a year of measured temperatures on 64 USGS rivers. Mean absolute error on the held-out half was 2.03 °C. Those sensors sit disproportionately on large and dam-regulated rivers, so the sample is not the modeled fleet. Every temperature is labeled as measured or modeled.
Seven factors, seven small rules
These are the defaults. Each river can override the weights and the ranges.
| Factor | Default weight | Scores best when |
|---|---|---|
| Flow | 25% | Inside the river's optimal band |
| Water temperature | 25% | Inside the river's optimal range |
| Wind | 15% | 8 km/h or less |
| Cloud cover | 15% | 60–90% in spring and fall, 40–80% in summer |
| Time of day | 10% | A seasonal window, such as 10am–2pm in spring |
| Pressure | 5% | 29.8–30.2 inHg and falling |
| Precipitation | 5% | Light rain, between 0.5 and 2 mm |
Flow scores 100 inside the optimal band and 50 at the edges of a wider "good" band, then keeps falling. Water temperature scores 100 in its optimal range and 60 at the river's stress threshold. Just past stress it drops to about 30, reaching 0 at the upper threshold. Wind scores 72 at 15 km/h and 42 at 25.
Some rules change with the season. Winter cloud scores 80 at 70% cover or less, and 70 above that. Summer time of day favors 5–9am and 6–9pm, and midday scores 35. Pressure starts at 80 in its best range, gains 10 when falling and loses 10 when rising.
I treat the moon as a nudge, not a weighted factor. Using Conway's approximation of the lunar phase, it adds three points near a new moon and two near a full moon. Around the quarters it takes one away.
A missing reading scores a neutral 50 and is flagged as unavailable. The total reads Excellent from 85, Good from 70, Fair from 50, Poor from 35, and Bad below that.
Every river sets its own weights
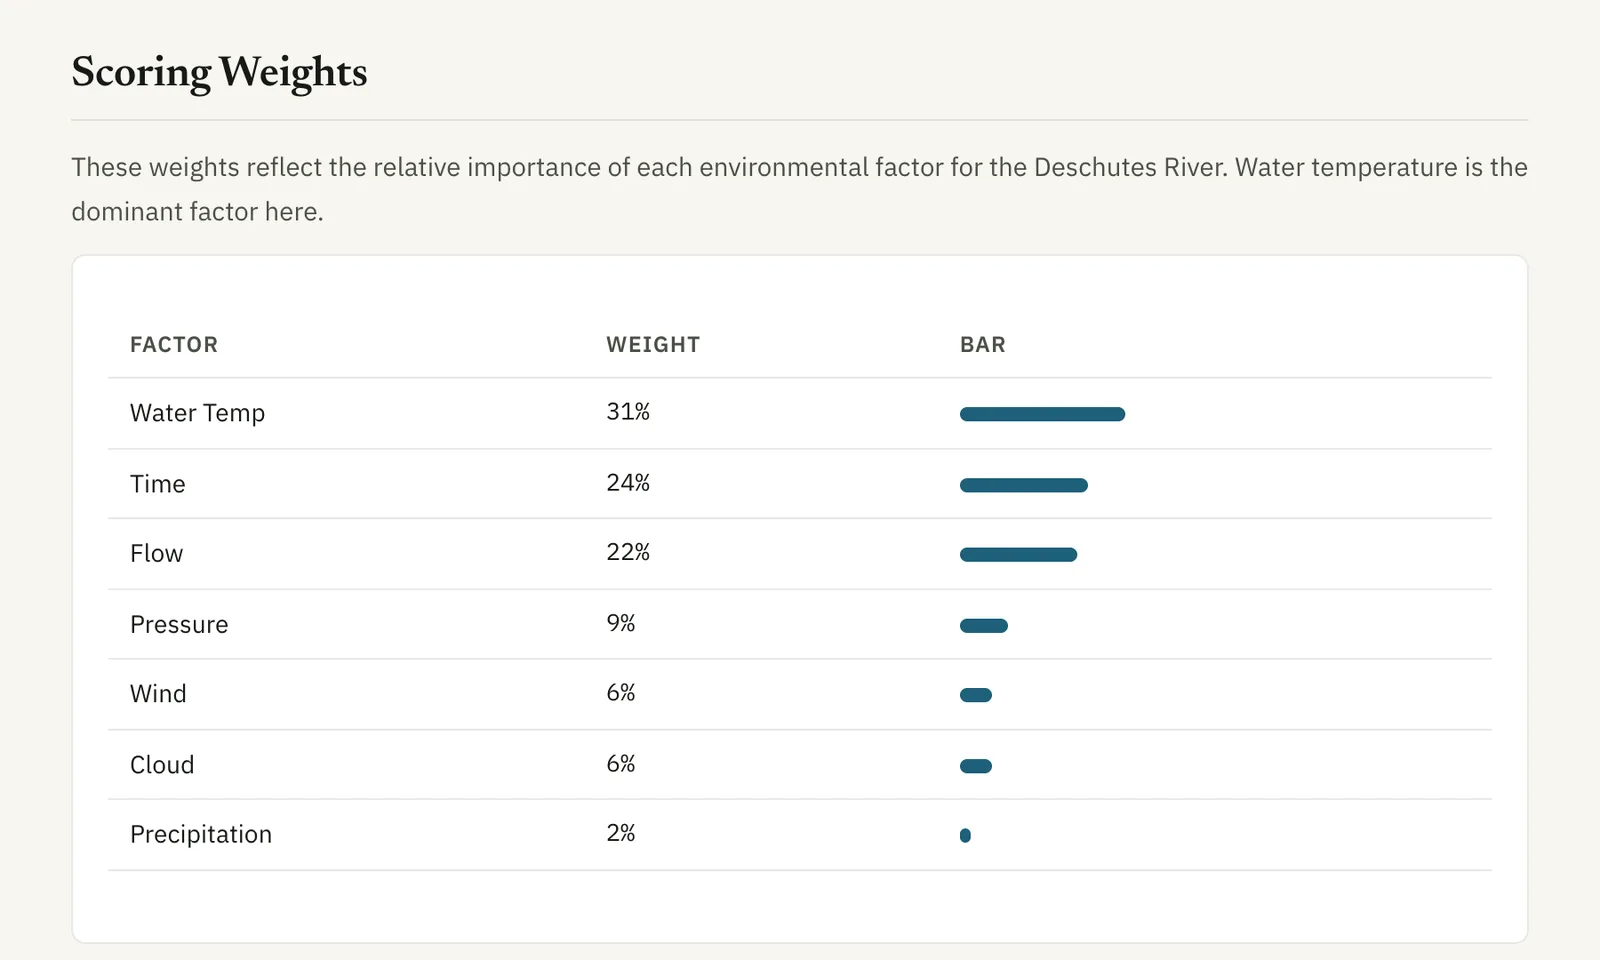
All 233 river configurations declare their own weights, and each set sums to one. Most move away from the defaults. The Deschutes gives water temperature 31%, time of day 24% and flow 22%. Pressure gets 9%, wind and cloud 6% each, and precipitation 2%. On a dozen rivers flow carries no weight; the code's example is an ungauged or dam-controlled reach.
The defaults are domain knowledge. For several rivers, the Cowichan among them, the weights started from fishing reports. Reports from fly shop websites and forums were scored for sentiment and matched to the conditions at the time. A correlation analysis showed which factors tracked good and bad reports. Then the weights were adjusted by hand. Judgment counts for more on rivers with few reports.
Henry's Fork is the only river whose flow bands change by month.
A score needs a yardstick
A 58 means different things on a coastal creek and on a tailwater. So the river page compares today with the river's own history. The line reads like "Better than N% of November days here." It ranks today against the best score of each day this month. Under five comparison days there is no percentile. If the newest stored snapshot is over 24 hours old, the line is hidden. When the scoring method changes, stored scores are never rescored; older history is left out instead.
Forecasts and hatches
Best time to fish scores each hour from 5am to 9pm, today and tomorrow, and ranks three-hour windows. Where NOAA publishes a river forecast for the gauge, those hours use NOAA's flow. Otherwise they use today's flow, labeled as an assumption. No window is picked at or above the river's very-high flow band.
On a river with a reporting sensor, projected water temperature starts from the actual reading. The gap to the model then fades with a 120-hour time constant. On the same 64 rivers, that cut mean absolute error over 1–48 hours from 2.06 °C to 1.24 °C.
Hatch probability sits beside the score, not inside it. An in-season hatch starts at 30; out of season it stays at 0. It gains up to 35 near the middle of its water-temperature range, or loses 15 outside it. Peak hours add 25, and the two hours either side add 10. True insect hatches gain 10 under more than 60% cloud. At 40 a hatch counts as active. Rivers without a verified hatch calendar show none.
When the score steps aside
A legal closure is never inferred from an environmental signal, and I don't encode recurring seasons. A verified one-off emergency order suppresses every recommendation, from the score and best-time windows to hatches and tactics. The page says "Closed" and that there is no score. I keep the readings published, so a reader who doubts the restriction data can still judge the water.
Each river has a methodology page with its own weights and bands. If a number looks wrong, send a correction through Outfish with the river, the claim and a source.